Handy Scripts
Send Email
curl -LO https://liuhaohua.com/tools/mail.py && chmod +x mail.py
Supports both plain text and HTML emails. Send via SMTP SSL or Mailjet API.
Quite useful when you feel like getting notified about your experiment progress.
| Environment Variable | Description |
|---|---|
MAIL_FROM |
The email address that will be used as the sender. |
MAIL_FROM_NAME |
User-friendly sender name. |
SMTP_HOST |
SMTP server host. |
SMTP_PORT |
SMTP server port. (default: 465) |
SMTP_USER |
SMTP server username. |
SMTP_PASS |
SMTP server password. |
MAILJET_AUTH |
Mailjet basic auth (format: {apikey}:{apisecret}) |
| Argument | Description |
|---|---|
--to |
Email address of the recipient. Seperated by spaces. Can be specified multiple times. |
--subject |
Subject of the email. |
--body |
Body of the email. |
--body-file |
Read the body of the email from the path specified. Overrides --body. |
--html |
Send the body as HTML if specified. |
--attach |
Attach files. Seperated by spaces. Can be specified multiple times. |
--via |
Send via SMTP SSL (smtp, default) or Mailjet HTTP API (mailjet) |
Example:
export MAIL_FROM=[email protected]
export MAIL_FROM_NAME=Bob
export SMTP_HOST=smtp.yyy.com
export SMTP_PORT=465
export SMTP_USER=abc
export SMTP_PASS=def
python mail.py
  --to [email protected] \
  --to [email protected] \
  --subject "Hello" \
  --body "Your experiment has finished." \
  --attach "result.txt" \
  --attach "run.log" \
  --via smtp
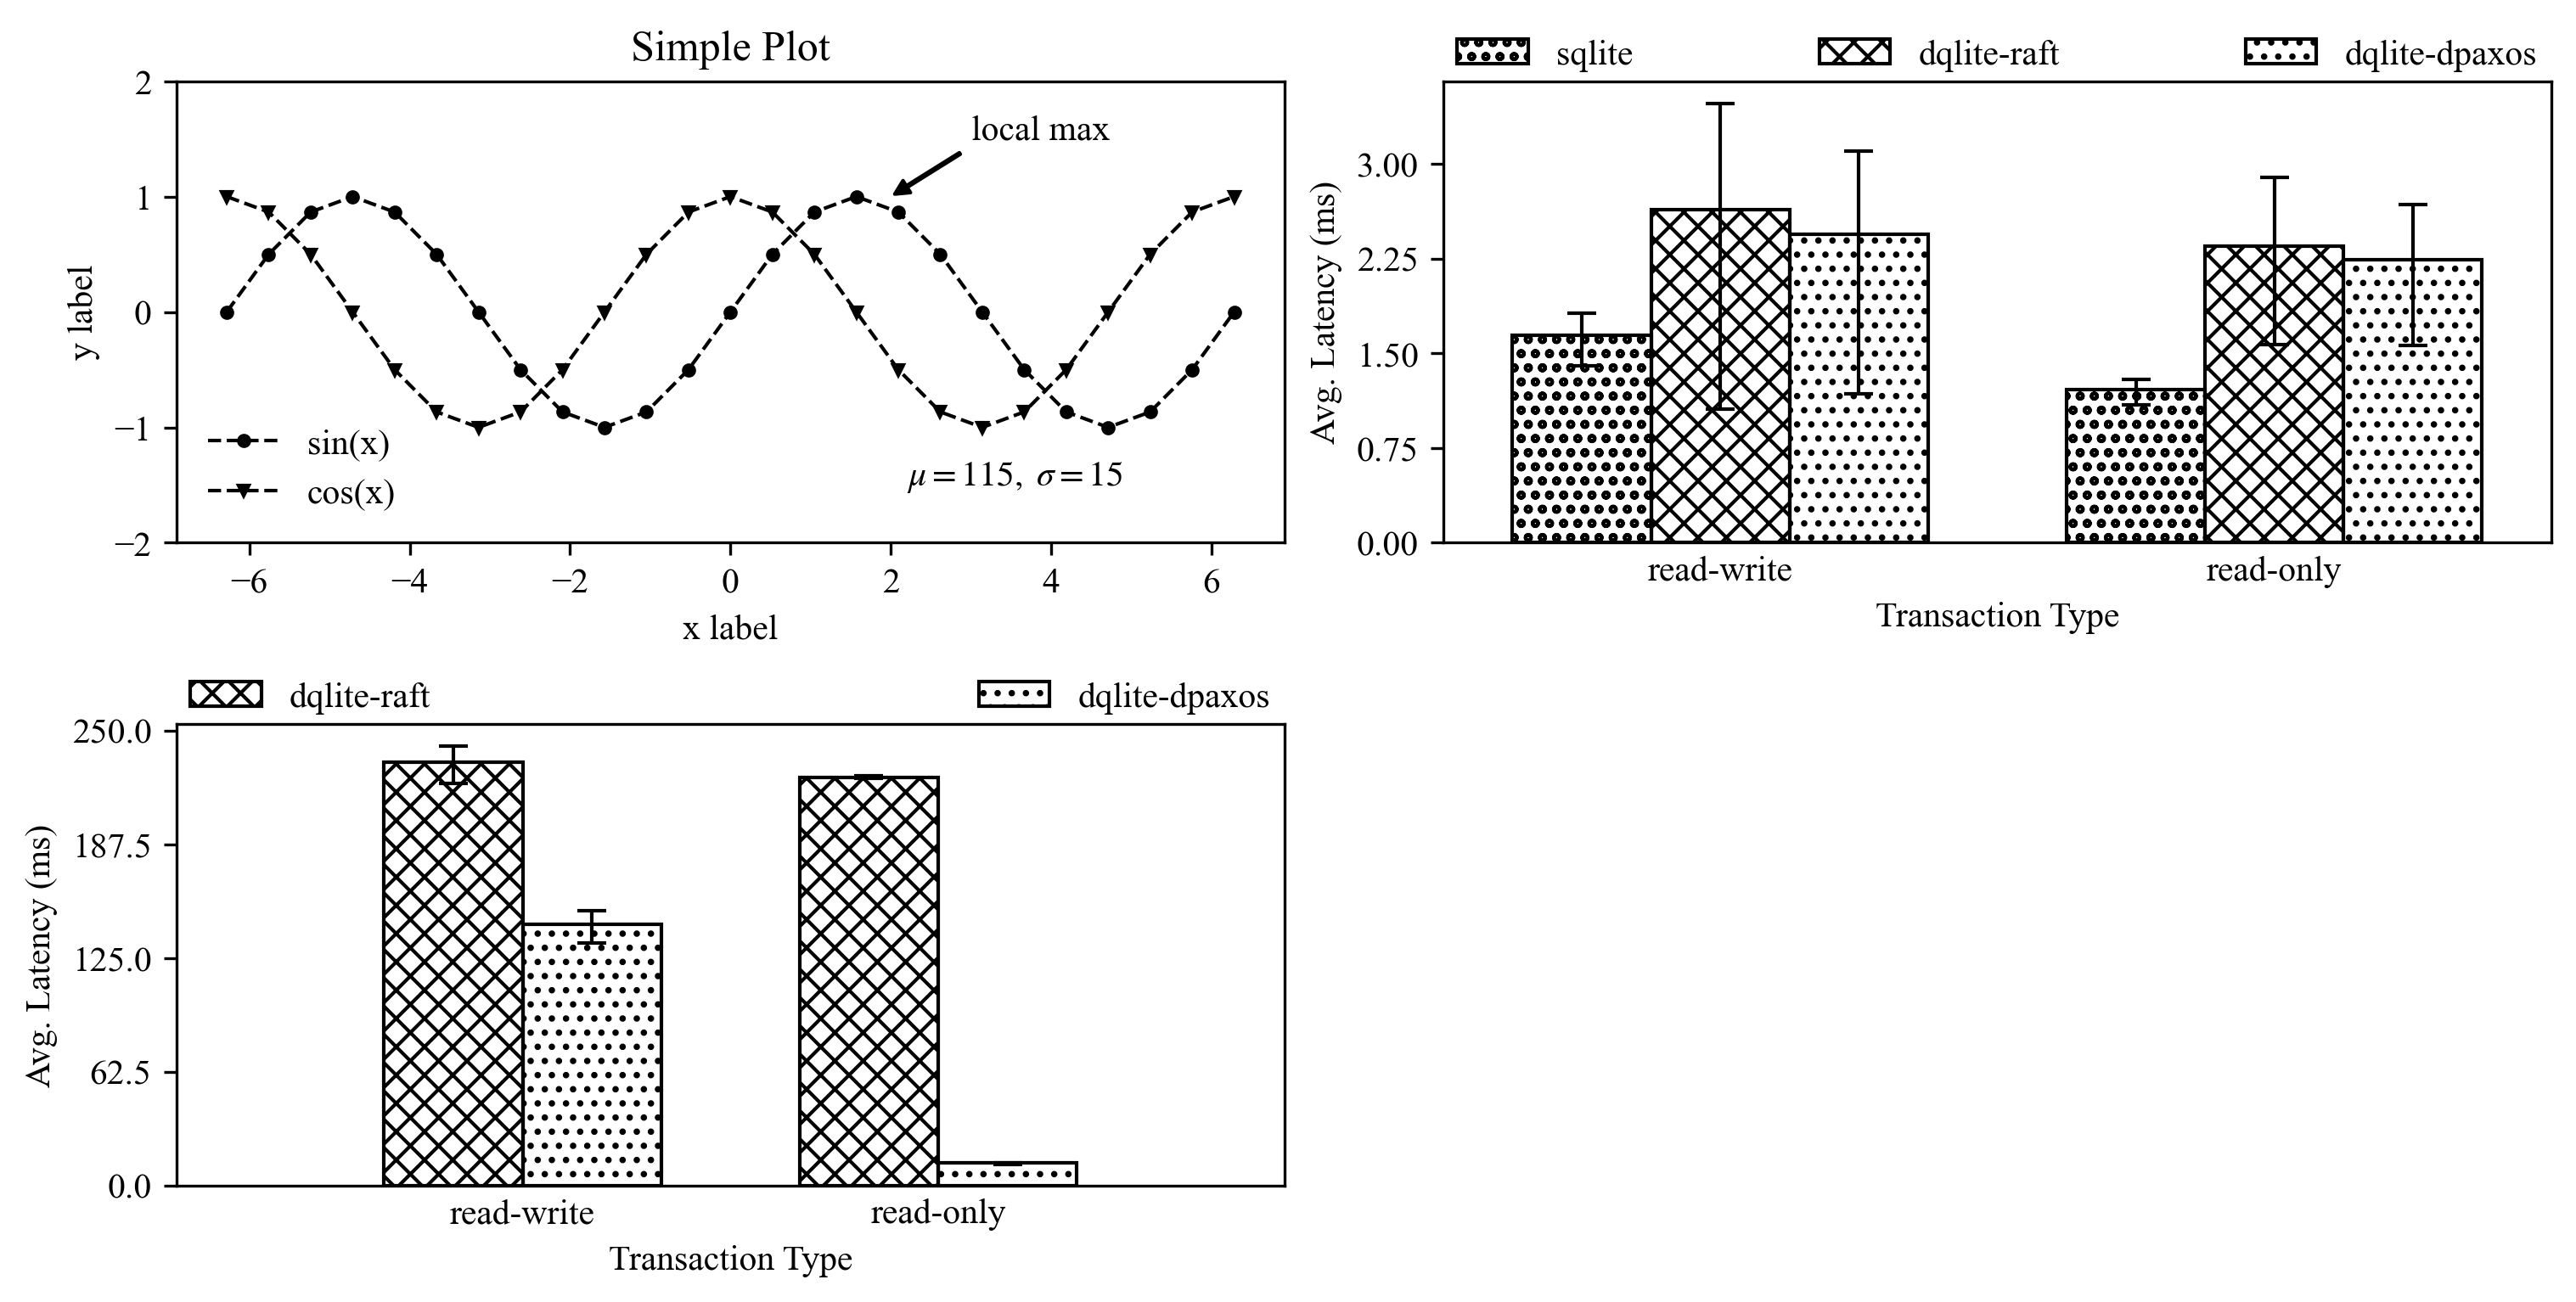
Plotting
curl -LO https://liuhaohua.com/tools/plot.py
Plot more professionally with matplotlib by setting a handful of parameters, especially fonts.
More like a template or reference for convenience without bothering to read the docs.
import matplotlib.pyplot as plt
import numpy as np

plt.rcParams['font.family'] = 'Times New Roman'
plt.rcParams['mathtext.fontset'] = 'stix'
plt.rcParams['savefig.dpi'] = 300

def _clear_legend(leg):
  leg.get_frame().set_edgecolor('b')
  leg.get_frame().set_linewidth(0.0)
  leg.get_frame().set_facecolor('none')

x = np.linspace(-2 * np.pi, 2 * np.pi, 25)
y = np.sin(x)
cosy = np.cos(x)

fig, axd = plt.subplot_mosaic([["A", "B"]], figsize=(10, 2.5))
ax = axd["A"]
ax.set_xlabel('x label')
ax.set_ylabel('y label')
ax.set_title("Simple Plot")
ax.plot(x, y, 'o', markersize=3, label="sin(x)", color='black', linewidth=1, linestyle='--')
ax.plot(x, cosy, 'v', markersize=3, label="cos(x)",
        color='black', linewidth=1, linestyle='--')
ax.text(2.2, -1.5, r'$\mu=115,\ \sigma=15$')
ax.annotate('local max', xy=(2, 1), xytext=(3, 1.5),
            arrowprops=dict(facecolor='black', width=0.5, headwidth=4, shrink=0.05, headlength=4))
ax.set_ylim(-2, 2)
leg = ax.legend()
_clear_legend(leg)

ax = axd["B"]
ax.set_xlabel('x label')
ax.set_ylabel('y label')
ax.set_title("Simple Plot")

# / , \\ , | , - , + , x, o, O, ., *
import matplotlib.patches as mpatches
ax.bar([1, 2, 3], [1, 2, 3], width=1, fill=False, hatch='/', tick_label="a")
leg = ax.legend(handles=[mpatches.Patch(label='a', hatch='////', fill=False)])
_clear_legend(leg)

plt.show()